Before we tackle how to create reports using Crystal Reports Designer, we'll look at three fairly simple ways to get your data out of EMu and into Microsoft Excel where it can be manipulated in many ways to produce sophisticated reports fairly quickly.
Tip: In the first method, Copy and paste directly out of EMu, it is possible to report on data in any field in the current module. Although you can include data in an attachment field (which generally includes Summary Data from an attached record), it is not possible to include data from any other field in an attached module. In the second method, Export data in CSV format for manipulation in Excel, it is possible to report on any field in the current module and in an attached module.
The three methods are:
Although using Visual Basic code will allow you to produce extremely sophisticated reports in Microsoft Excel, it is nonetheless very easy to produce highly useful reports in Excel using a simple copy and paste of data directly out of a module in List View.
Note: If all the data you need to report on is in a single module, it is easy to get the data into an Excel spreadsheet, and then manipulate the data as required in Excel. If you wish to include linked data from more than one module however, you could export report data to a CSV file (see below) or use Visual Basic code.
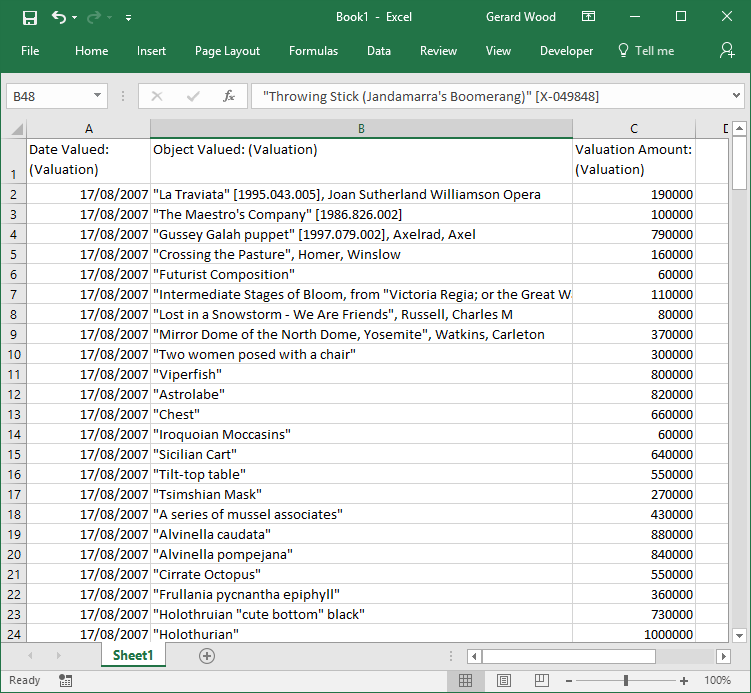
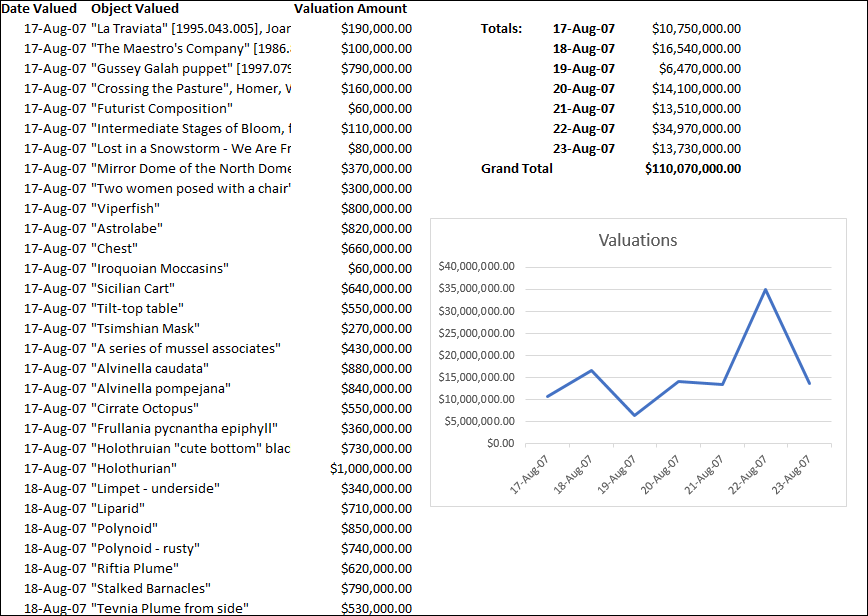
In this example we retrieve records in the Valuations module and create a simple Excel report that totals some figures and generates a chart:
- Search for or retrieve a group of records on which to report.
- Select or create a List View that includes the fields required for your report:
Note: If a List View doesn't exist with all the fields on which you wish to report, you will obviously need to create it.
- Select the records that you wish to include in the report (use
SHIFT+F8to select all records in the result set). - Copy the selected records.
Select Copy on the Edit tab of the Ribbon (
CTRL+C)-OR-
Right-click the results and select Copy from the context menu that displays.
Tip: If a field you copy out of EMu is a table of values, the data will not format correctly when it is pasted into Excel. A table of values is a field with more than one row; each row can hold a separate value (e.g. Other Names: (Person Details) in the Parties module). See The Copy Special utility for a solution to this.
- Open Microsoft Excel.
- Select Edit>Paste Special from the Excel Menu bar and select CSV from the Paste Special box.
Pasting data this way (rather than using the keyboard shortcut,
CTRL+V) ensures that numbers are formatted as numbers or currency rather than text: - Format the data and manipulate it as required to produce your report.
In this example, this involved:
- Formatting date and currency values.
- Sorting the data in ascending order.
- Formatting the column headings.
- Adding a grand total.
- Calculating totals for various groupings of data.
- Displaying these totals in a chart.
Although using Visual Basic code will allow you to produce extremely sophisticated reports in Microsoft Excel, it is nonetheless very easy to produce highly useful reports by exporting data out of EMu directly into Microsoft Excel.
In this example we create a simple Excel report in EMu that exports data in CSV format. As we have seen (Copy and paste directly out of EMu above), once in Microsoft Excel, the data can be manipulated to produce a report.
The main difference between this method and simply copying and pasting data out of List View (see above) is that it is possible with this method to export any field in the current module, as well as fields in an attached module (see the Note to Step 10 below however):
- Search for or retrieve a group of records on which to report.
- Select Reports on the Home tab of the Ribbon to display the Reports box.
- Click New to display the Report Properties box.
- Enter a descriptive name for the Report in the top text box.
When the report is created, this title will be listed in the Reports box.
- Select Export CSV Format from the Type drop list:
- On the Fields tab click Add to display the Report Fields box.
The Report Fields box lists all fields in the current module, as well as fields in attached modules (an attachment field is indicated by the plus
 icon):
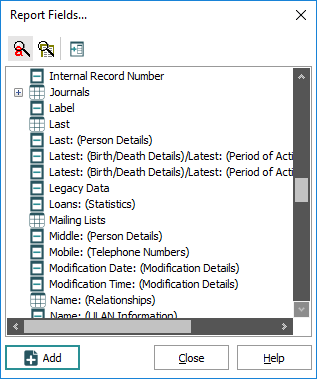
Report Fields options and icons include:
Options Icon Description Show Prompts

Display the EMu field name as it displays in a module window.
Show Column Names

Display the back-end field name.
Attach Module

Display fields in attached modules that can be included in the report.
Single field
Indicates that this field is a single field (i.e. holds one value).
Multi-field table

Indicates that this field is a table of values.
Expand

Indicates that this field is an attachment field in the current module. Select the icon to list fields in the target
 An attachment is made from one record to another. The record from which the attachment is initiated is the Primary record; the record that is attached is called the Target. (attached) module that can be included in your report.
Multi-field table AND an attachment field

Indicates that this attachment field is also a table of values (see the Note about Table as Text below).
Double-nested table AND an attachment field

Indicates that this attachment field is a double nested table (see the Note about Table as Text below).
- Select a field and click Add
-OR-
Double-click the field.
The field is added to the Fields list in the Report Properties box.
- When all required fields are added, click Close in the Report Fields box.
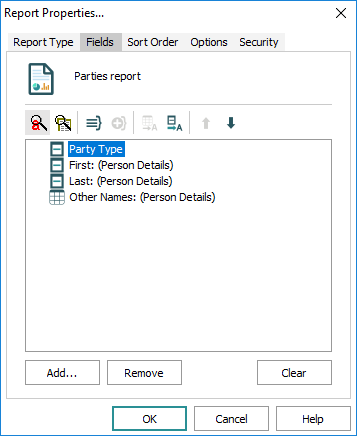
The Report Properties box lists all the added fields:
When we run the report, the selected fields will be output as one or more .csv files: the main .csv file and a separate .csv file for:
- Any group created using the Create Group
 button in the Report Properties box (click here for details).
 - Any field that is a table of values, for example, Other Names: (Person Details) in the example above. In the Report Properties box, a field that is a table of values is indicated by a table
 icon beside the field name.
When the report is run, an additional file called schema.ini is created, which contains details about each .csv file (what fields are included, their data type, formats, etc.).
In this example, two .csv files will be generated when the report is run: eparties.csv (the main .csv file) and NamOther.csv (holding values from the Other Names: (Person Details) field. When producing an Export CSV Format report it is generally simpler to have all the data in a single .csv file.
To achieve this:
- Select the field name of the table of values (Other Names: (Person Details) in this example) and click Table as Text
 .
.The fields in the table will now be included in the main .csv file (eparties.csv in this example) rather than in a separate .csv file (see Tables for more detail).
Note: If the field is an attachment field AND a table of values (indicated by the two icons
 ) or a double nested table (indicated by the two icons
  ), it is not possible to include its data in the main .csv file using this method. To include fields like this in your report, it will generally be more appropriate to create a Crystal report.
- Any group created using the Create Group
- In the Report Properties box, set Sort Order as required.
- Set Sort Options as required.
- Set Security options as required.
- Click OK.
The new report now displays in the Reports box:

- Run the report by selecting it in the Reports box and then selecting:
Report to export the current or selected records
-OR-
Report All to export all listed records.
- A dialogue box displays allowing you to select a location in which to save the exported data. Navigate to the desired location and click OK.
In this example two files (eparties.csv and schema.ini) will be saved.
- Open the .csv file to view the raw data.
As we have seen above, once the data is in Excel it can be manipulated to produce a report.
Depending on the report Type specified for your report, one or more files are generated and saved to a local drive. Typically these are .csv (Comma Separated Values) files and they are saved to:
C:\Users\[username]\AppData\Local\KESoftware\Reports\e[module name]
For example, a report run in the Parties module, will generally save a file called eparties.csv to:
C:\Users\[username]\AppData\Local\KESoftware\Reports\eparties
These .csv files contain the data that a report application (such as Microsoft Word, Excel or Crystal Reports) uses to generate the report.
Note: If double-clicking a .csv to open it results in the data displaying as comma separated rather than laid out in columns, close the file. In Excel select File>Open and navigate to the .csv file. The Text Import Wizard will display with options that allow you to select how to delimit data in the .csv file. Typically, you will place a tick in the Comma checkbox (Step 2 of the wizard) in order to lay out the data in one column per field in the .csv file.
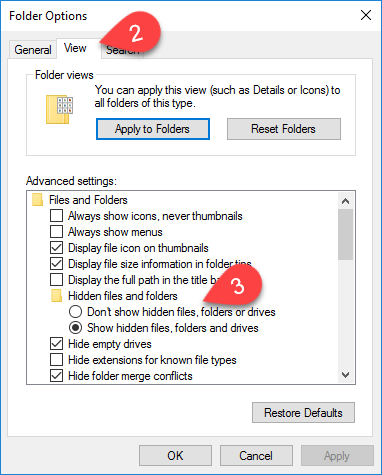
If Windows Explorer is configured to hide system files, this folder may not be visible. To view the folder:
- Select Options on the View tab of the Windows Explorer Ribbon to display the Folder Options.
- Select the View tab.
- Select the Show hidden files and folders radio button:
Sometimes the .csv files may be all that is required in the way of report output: in this case you could simply open the .csv file in Microsoft Excel and view and manipulate the data as required.

